

- >>Climate table // Weather by Month Adelaide
- >>Climograph Adelaide
- >>average temperature by month Adelaide
- >>Weather Adelaide
This location is situated in the southern region of the globe. Summer starts here at the end of December and ends in March. There are the months of summer: December, January, February, March.
The Adelaide is the Capital of
Climograph Adelaide
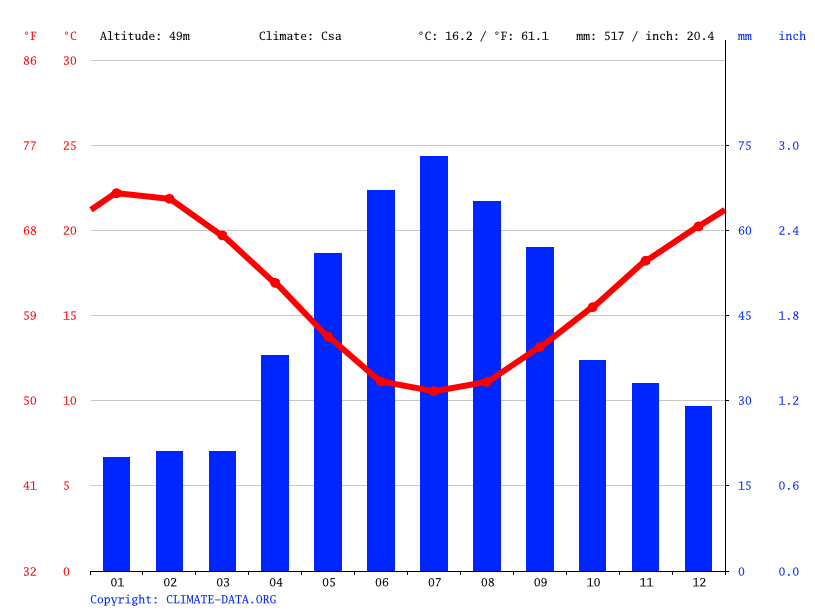

During January, the amount of precipitation is at its lowest, with only 20 mm | 0.8 inch recorded. The highest amount of precipitation occurs during the month of July, with an average quantity reaching up to 73 mm | 2.9 inch.
average temperature by month Adelaide
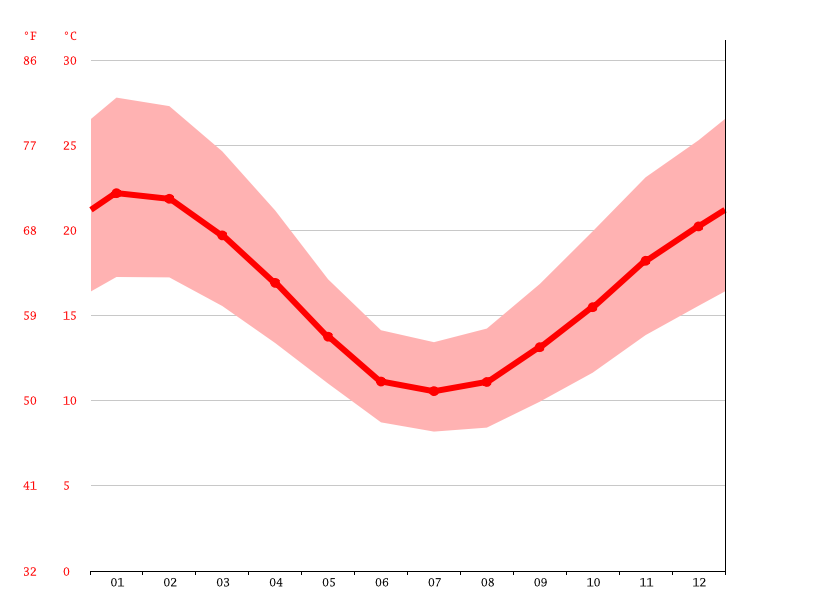
The month of maximum warmth in a year is January. The average temperature during this period reaches up to 22.2 °C | 71.9 °F, making it the hottest time of the year. The month of July registers the most frigid temperatures throughout the year, with an average low temperature of 10.6 °C | 51.0 °F.
Climate table // Weather by Month Adelaide
| Avg. Temperature °C (°F) | Min. Temperature °C (°F) | Max. Temperature °C (°F) | Precipitation / Rainfall mm (in) | Humidity (%) | Rainy days (d) | avg. Sun hours (hours) | |
|---|---|---|---|---|---|---|---|
| January |
22.2 (71.9) |
17.3 (63.1) |
27.8 (82) |
20 (0.8) |
48% | 2 | 11.0 |
| February |
21.9 (71.3) |
17.2 (63) |
27.3 (81.1) |
21 (0.8) |
51% | 2 | 10.0 |
| March |
19.7 (67.5) |
15.6 (60) |
24.6 (76.3) |
21 (0.8) |
55% | 3 | 9.0 |
| April |
16.9 (62.4) |
13.4 (56.1) |
21.2 (70.1) |
38 (1.5) |
60% | 4 | 8.0 |
| May |
13.8 (56.8) |
11 (51.8) |
17.1 (62.8) |
56 (2.2) |
71% | 7 | 6.0 |
| June |
11.1 (52) |
8.7 (47.7) |
14.1 (57.4) |
67 (2.6) |
77% | 8 | 6.0 |
| July |
10.6 (51) |
8.2 (46.7) |
13.4 (56.2) |
73 (2.9) |
77% | 9 | 6.0 |
| August |
11.1 (52) |
8.4 (47.2) |
14.2 (57.6) |
65 (2.6) |
73% | 9 | 7.0 |
| September |
13.1 (55.7) |
9.9 (49.9) |
16.8 (62.3) |
57 (2.2) |
68% | 8 | 8.0 |
| October |
15.5 (59.9) |
11.6 (53) |
19.9 (67.9) |
37 (1.5) |
58% | 5 | 9.0 |
| November |
18.2 (64.8) |
13.8 (56.9) |
23.1 (73.6) |
33 (1.3) |
54% | 4 | 10.0 |
| December |
20.2 (68.4) |
15.6 (60) |
25.3 (77.5) |
29 (1.1) |
50% | 4 | 11.0 |
| January | February | March | April | May | June | July | August | September | October | November | December | |
|---|---|---|---|---|---|---|---|---|---|---|---|---|
| Avg. Temperature °C (°F) |
22.2 °C (71.9) °F |
21.9 °C (71.3) °F |
19.7 °C (67.5) °F |
16.9 °C (62.4) °F |
13.8 °C (56.8) °F |
11.1 °C (52) °F |
10.6 °C (51) °F |
11.1 °C (52) °F |
13.1 °C (55.7) °F |
15.5 °C (59.9) °F |
18.2 °C (64.8) °F |
20.2 °C (68.4) °F |
| Min. Temperature °C (°F) |
17.3 °C (63.1) °F |
17.2 °C (63) °F |
15.6 °C (60) °F |
13.4 °C (56.1) °F |
11 °C (51.8) °F |
8.7 °C (47.7) °F |
8.2 °C (46.7) °F |
8.4 °C (47.2) °F |
9.9 °C (49.9) °F |
11.6 °C (53) °F |
13.8 °C (56.9) °F |
15.6 °C (60) °F |
| Max. Temperature °C (°F) |
27.8 °C (82) °F |
27.3 °C (81.1) °F |
24.6 °C (76.3) °F |
21.2 °C (70.1) °F |
17.1 °C (62.8) °F |
14.1 °C (57.4) °F |
13.4 °C (56.2) °F |
14.2 °C (57.6) °F |
16.8 °C (62.3) °F |
19.9 °C (67.9) °F |
23.1 °C (73.6) °F |
25.3 °C (77.5) °F |
| Precipitation / Rainfall mm (in) |
20 (0) |
21 (0) |
21 (0) |
38 (1) |
56 (2) |
67 (2) |
73 (2) |
65 (2) |
57 (2) |
37 (1) |
33 (1) |
29 (1) |
| Humidity(%) | 48% | 51% | 55% | 60% | 71% | 77% | 77% | 73% | 68% | 58% | 54% | 50% |
| Rainy days (d) | 2 | 2 | 3 | 4 | 7 | 8 | 9 | 9 | 7 | 5 | 4 | 4 |
| avg. Sun hours (hours) | 11.1 | 10.3 | 8.9 | 7.9 | 6.3 | 6.1 | 6.1 | 6.7 | 7.6 | 8.8 | 10.1 | 10.6 |
Data: 1991 - 2021 Min. Temperature °C (°F), Max. Temperature °C (°F), Precipitation / Rainfall mm (in), Humidity, Rainy days. Data: 1999 - 2019: avg. Sun hours
The variation in precipitation between the months with the lowest and highest levels of rainfall is 53 mm | 2 inch, as observed. Throughout the course of a year, there is an observable fluctuation in average temperatures by 11.6 °C | 20.9 °F.
It is observed that June (77.05) has the highest relative humidity, whereas January (47.82) experiences the lowest. The month with the highest precipitation is July (11.53 days), whereas the one with the lowest amount of rainfall is January (3.30).
Adelaide weather and climate for every month
Hours of sunshine in Adelaide
- avg. hours of sun
- Total hours of sun


At Adelaide, the month that boasts of the highest number of daily sunshine hours is January with an average duration of 11.15. The total count for this period accumulates to a staggering sum of 345.61 sunlight hours.
The location of Adelaide experiences the least number of daily hours with sunshine during January, wherein an average of only 6.09 hours is recorded. The total count for this month's sunlight duration accumulates to a sum value equivalent to 182.63.
Throughout the year, Adelaide experiences approximately 3050.41 hours of sunshine. The average monthly duration of sunlight is estimated to be around 254.2.
Airport close to Adelaide
The closest Airports of Adelaide are: Adelaide Airport (ADL) 5.86km,Port Lincoln Airport (PLO) 251.48km,Mildura Airport (MQL) 328.30km
You can reach Adelaide from this Cities by Plane: Sydney (SYD), Canberra (CBR), Perth (PER), Alice Springs (ASP), Cairns (CNS), Mildura (MQL), Dubai (DXB), Gold Coast (OOL), Auckland (AKL), Singapore (SIN), Adelaide (ADL), Brisbane (BNE), Darwin (DRW), Port Lincoln (PLO), Kuala Lumpur (KUL), Melbourne (MEL), Hong Kong (HKG)
